Charts & Graphics
- 156sampling sites
- 15,804regular-season samples
- 2012–2026seasons
This portal displays data from the Community Water Quality Testing (CWQT) program, a community science initiative facilitated by the SWIM Coalition. Values represent the Most Probable Number (MPN) of enterococcus colonies per 100 ml. Enterococcus is a fecal indicator bacteria, and its presence in water is correlated to combined sewer overflows. Water quality is judged based on NYC Department of Health and Mental Hygiene (DOH) standards for swimming, which allows us to imagine a future where all of NYC’s coastline is used and accessed like a public beach. Based on these standards, a geometric mean of 35 or less is good, 35–104 is advisory, and above 104 is poor.
Click any chart below to open it full size.
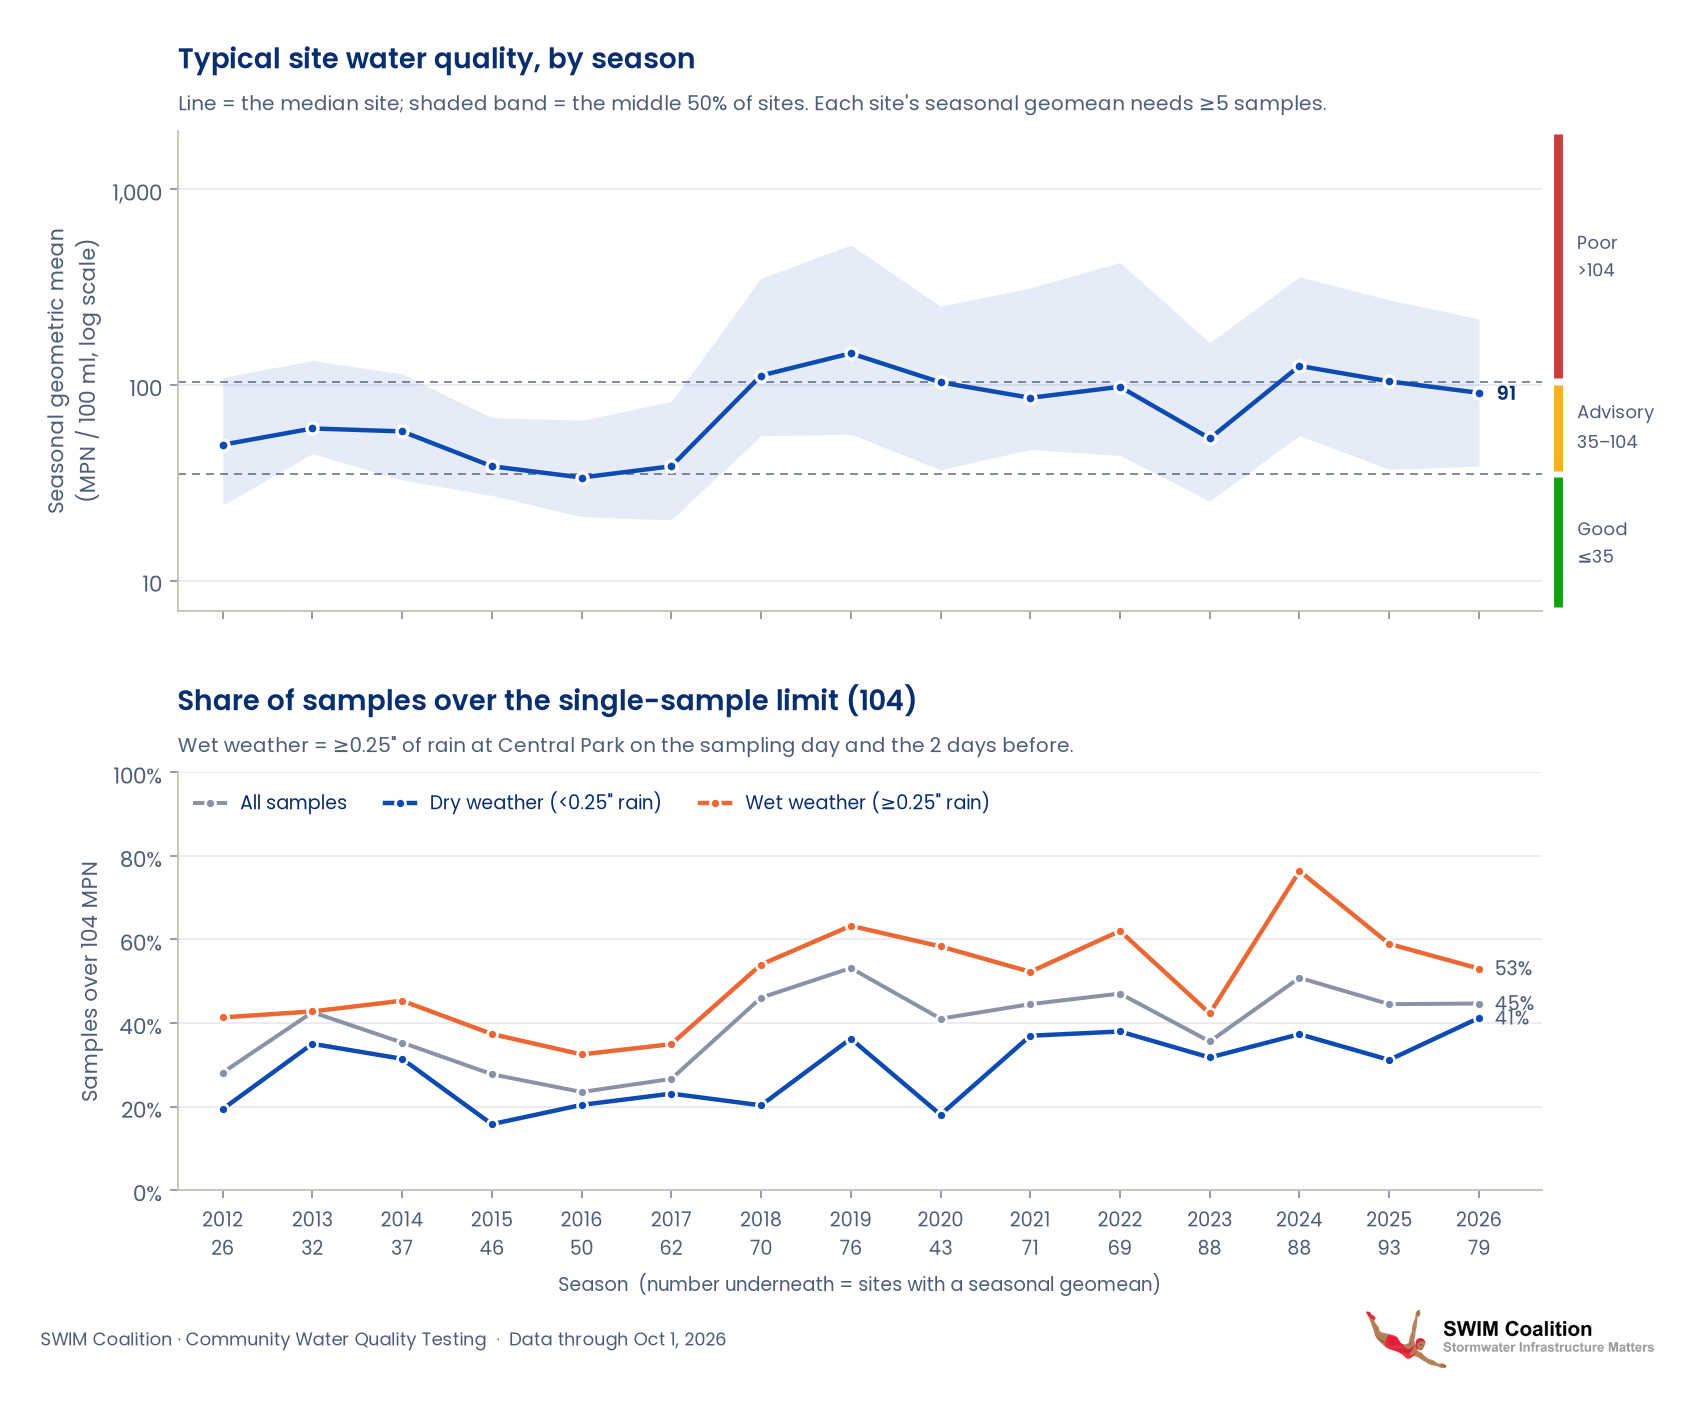
1. Water quality over time, all sites
The top panel shows the typical (median) site's geometric mean each season; the shaded band covers the middle half of sites. The bottom panel shows the share of samples above the single-sample limit of 104, split into dry and wet weather.
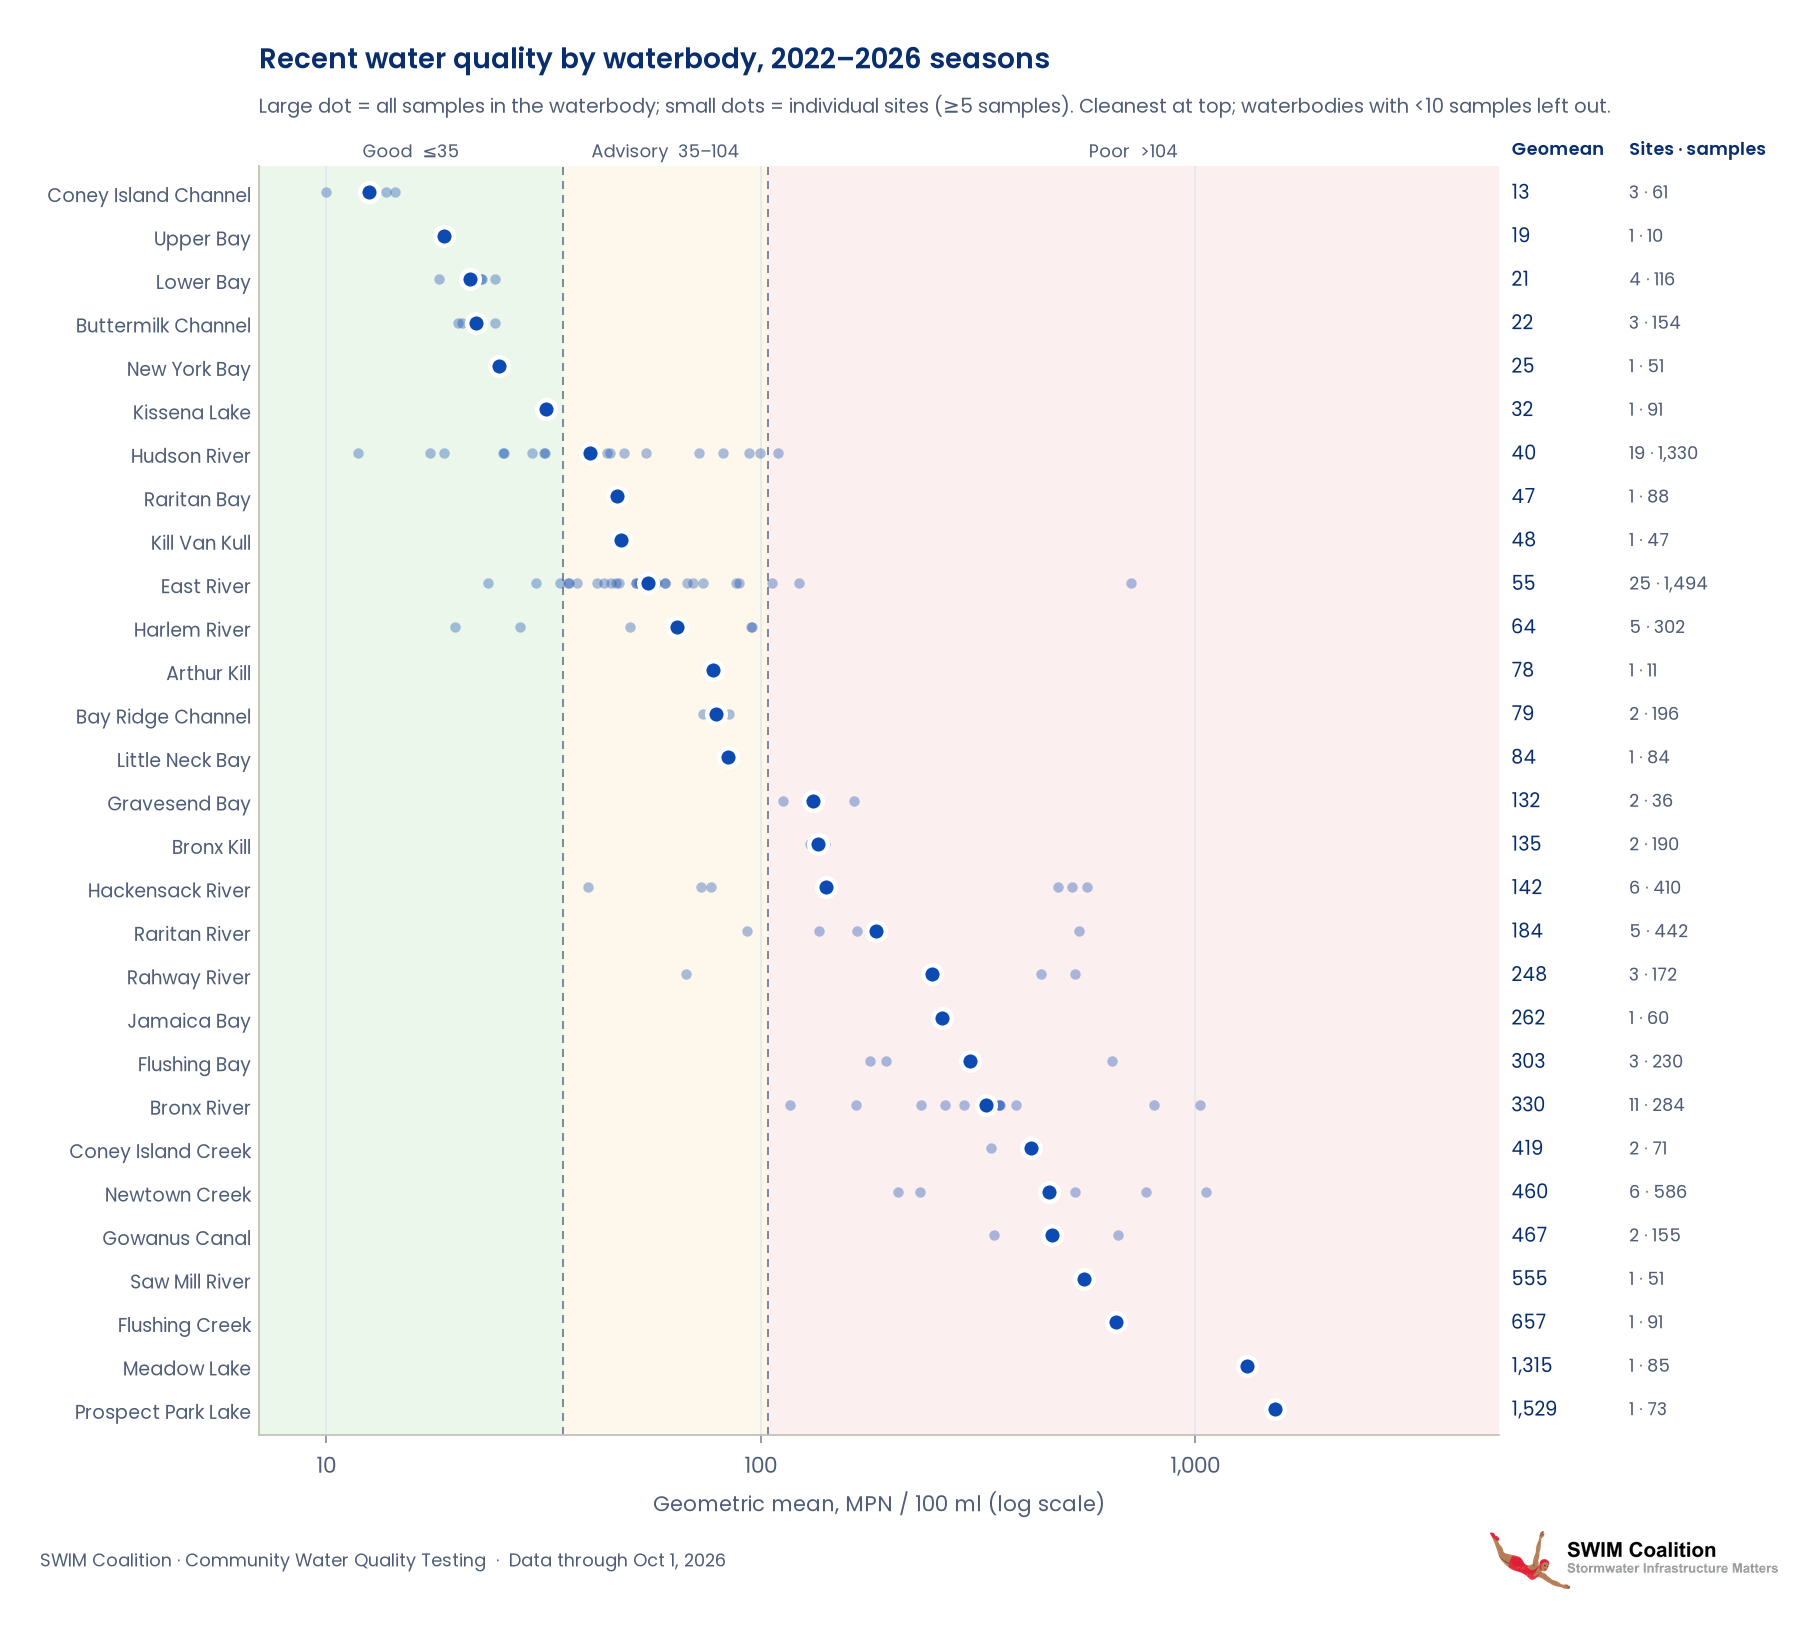
2. Recent water quality by waterbody (2022–2026)
Each row is a waterbody, ordered from cleanest to most contaminated over the last 5 seasons. The large dot is the geometric mean of all samples in that waterbody, and small dots are its individual sites. The right-hand side shows the number of sites and samples from each waterbody.
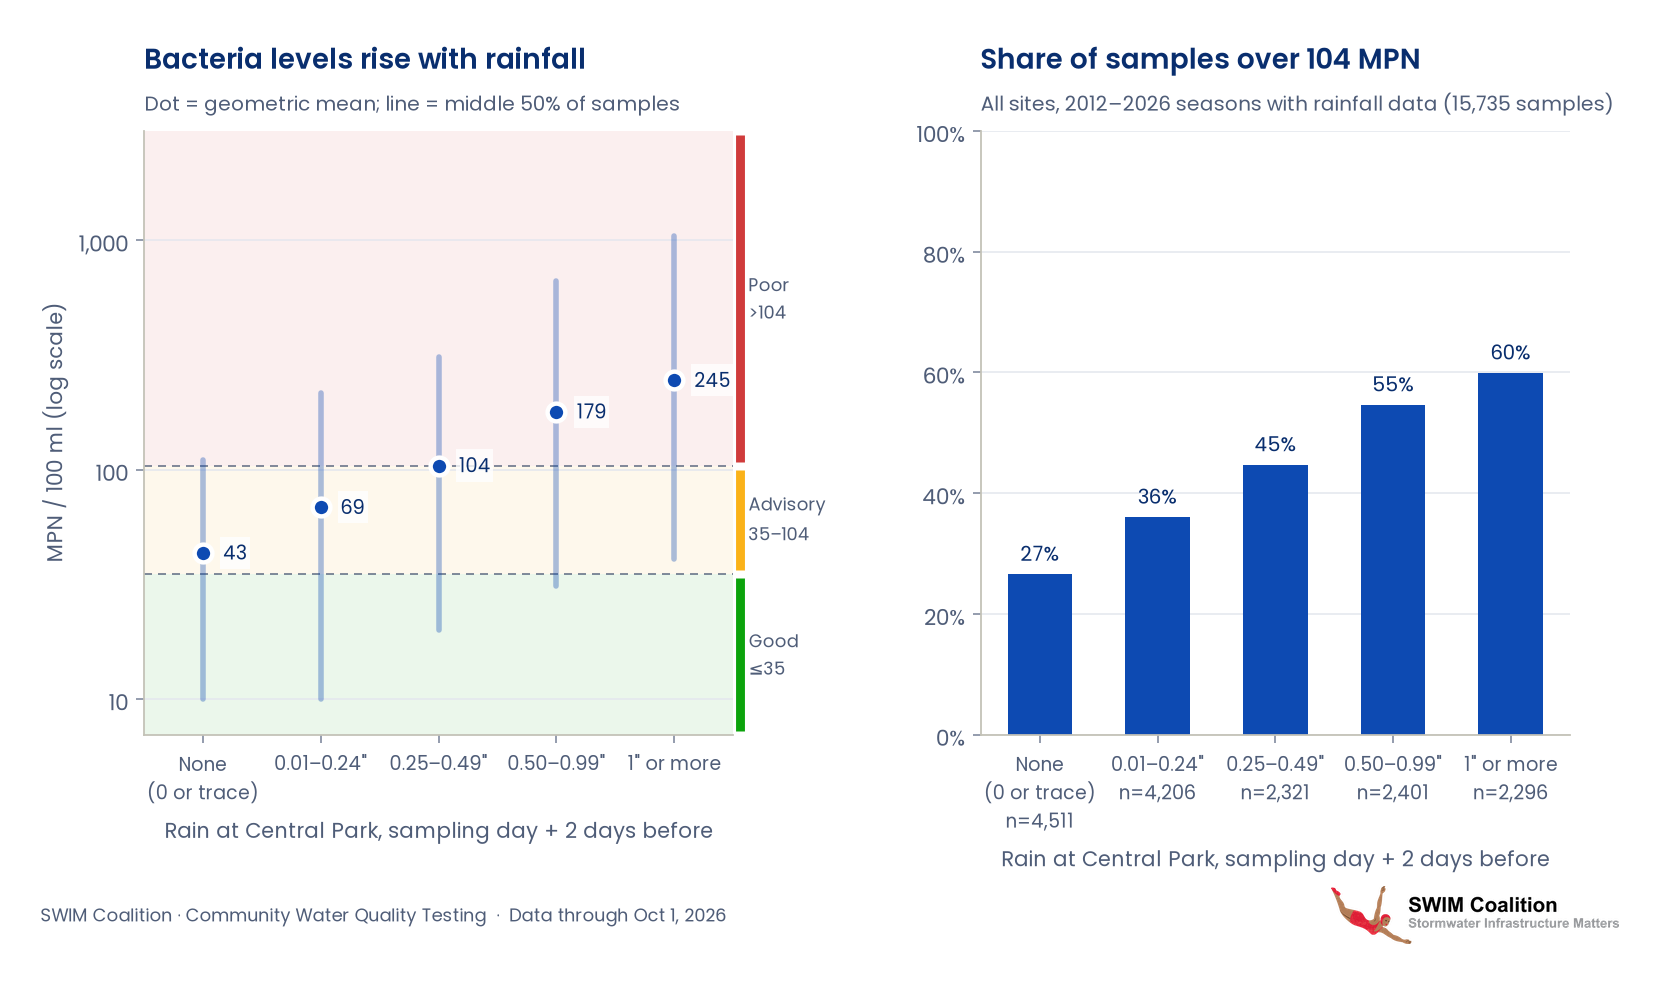
3. How rainfall affects bacteria levels
Samples are grouped by how much rain fell at Central Park on the sampling day and the two days before. Heavy rain overwhelms the combined sewer system and sends sewage-contaminated overflow into the waterways, so bacteria levels and the share of samples above 104 rise steadily with rainfall.
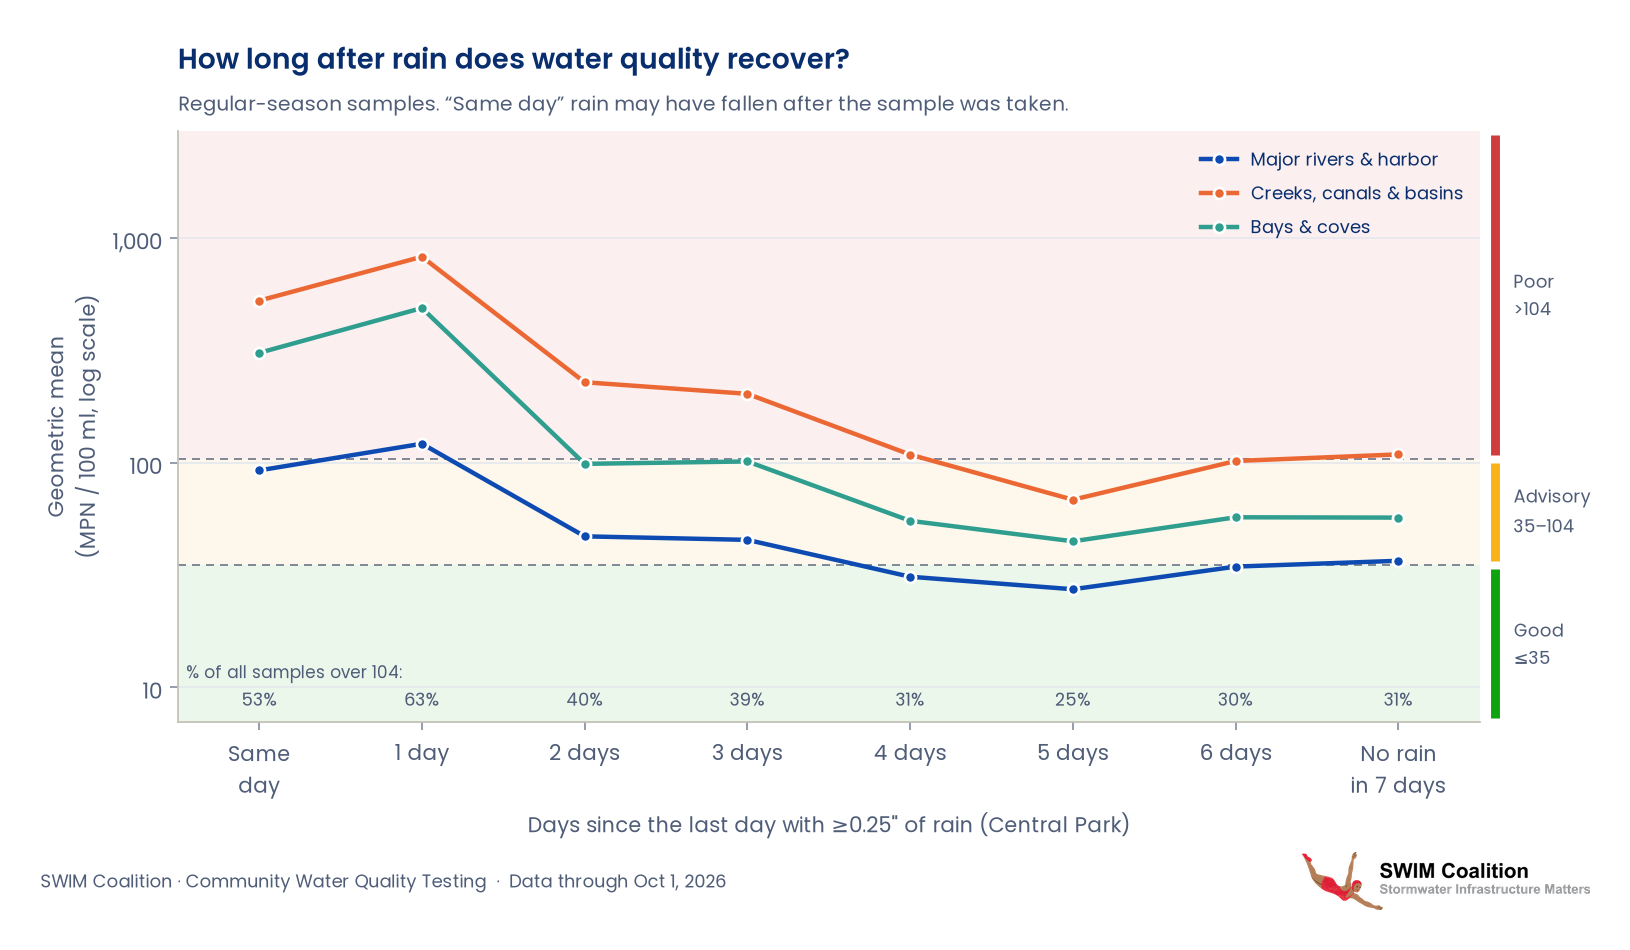
4. Recovery after rain
Samples are grouped by how many days had passed since the last day with at least 0.25" of rain at Central Park. Bacteria peak the day after rain and fall over the following days. The big rivers and the harbor are mostly back to normal after about two days, while creeks, canals and enclosed basins take four to five. The numbers along the bottom show the share of samples above 104. Rain on the sampling day itself may have fallen after the sample was taken.
5. Green infrastructure installations
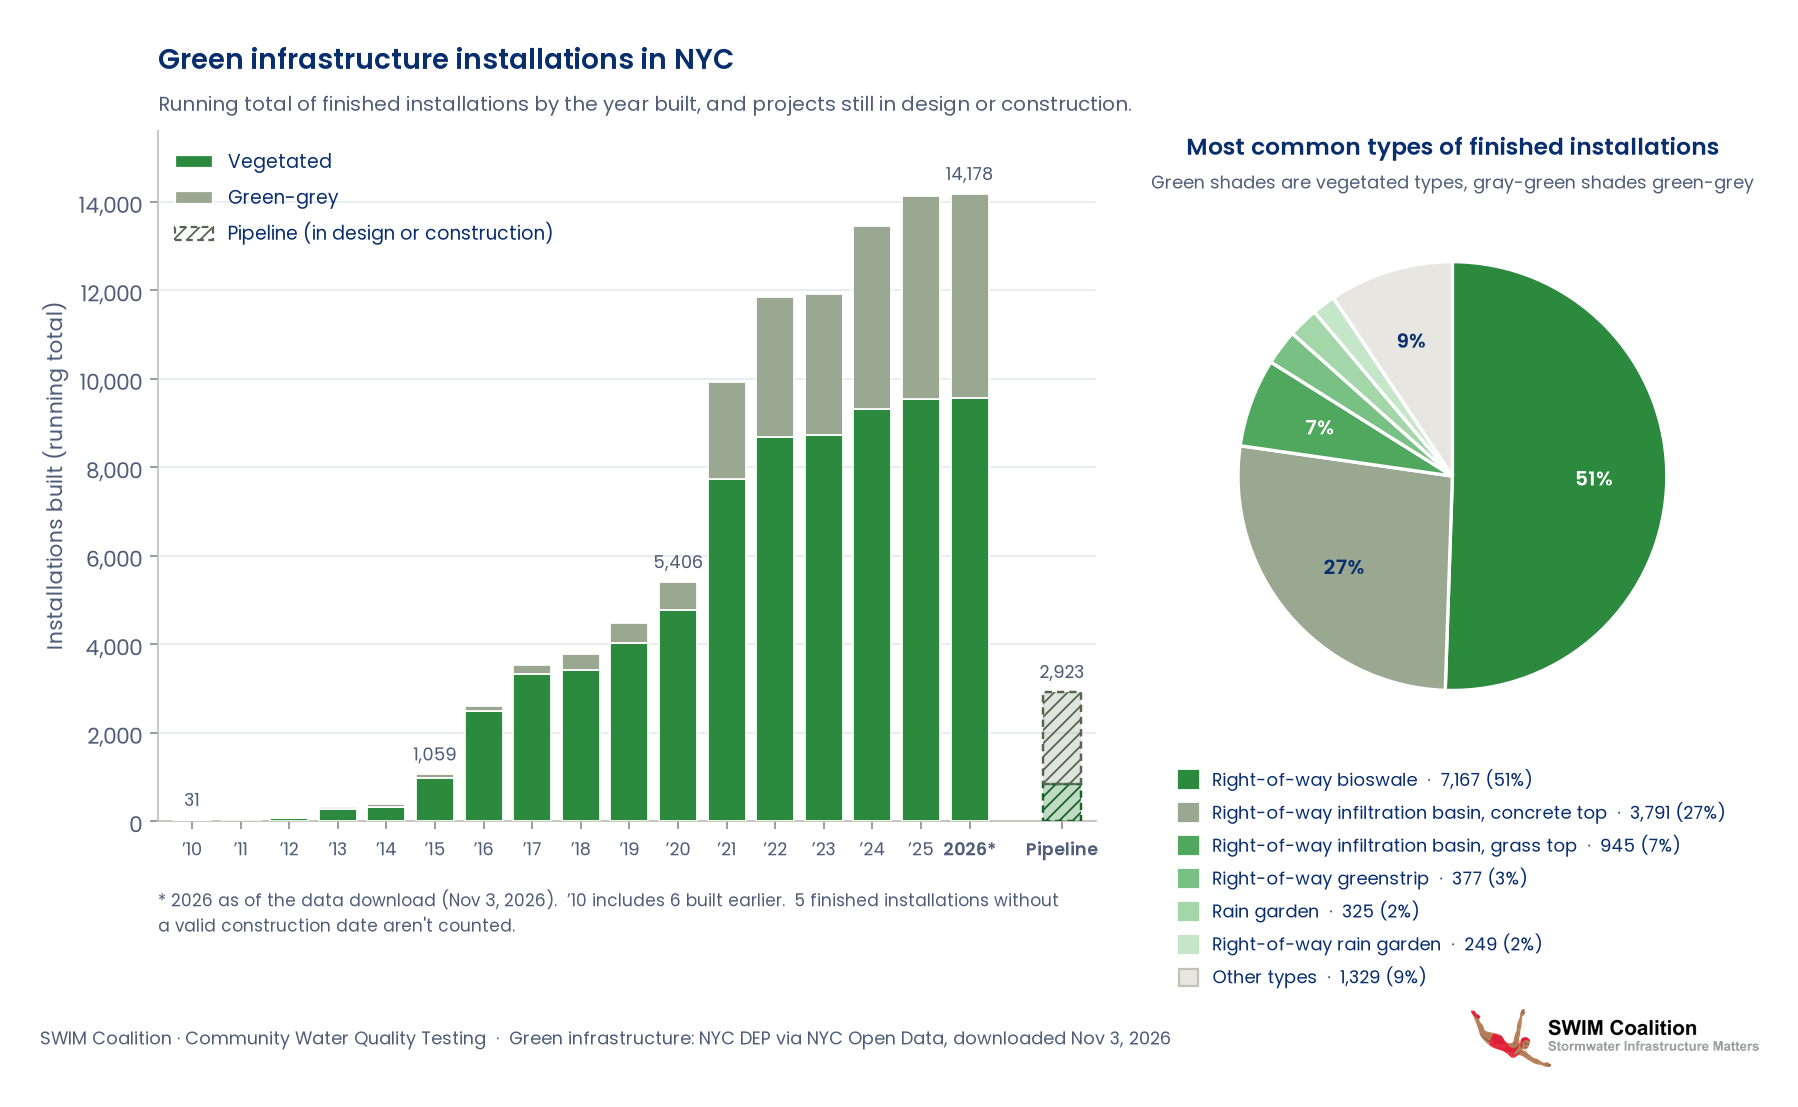
Green infrastructure (GI) captures stormwater where it falls, in bioswales, rain gardens, green roofs, porous pavement and underground storage, so less runoff reaches the sewers. Where sewers are combined, that means fewer overflows of sewage-contaminated water into the waterways CWQT samples. Vegetated GI also brings co-benefits such as shade, cooler streets, cleaner air and habitat for birds and pollinators.
The left chart shows the running total of GI installations finished in NYC, by the year they were built, split into vegetated GI (bioswales, rain gardens, green roofs…) and green-grey GI (porous pavement, concrete-top infiltration basins, underground storage…). The hatched bar counts the 2,923 pipeline projects still in design or under construction. The pie shows the most common types among the 14,183 finished installations. The data are NYC DEP's green infrastructure datasets from NYC Open Data, downloaded November 3, 2026 (the 2026 total is as of that date), and are the same as the map's Green Infrastructure layers.
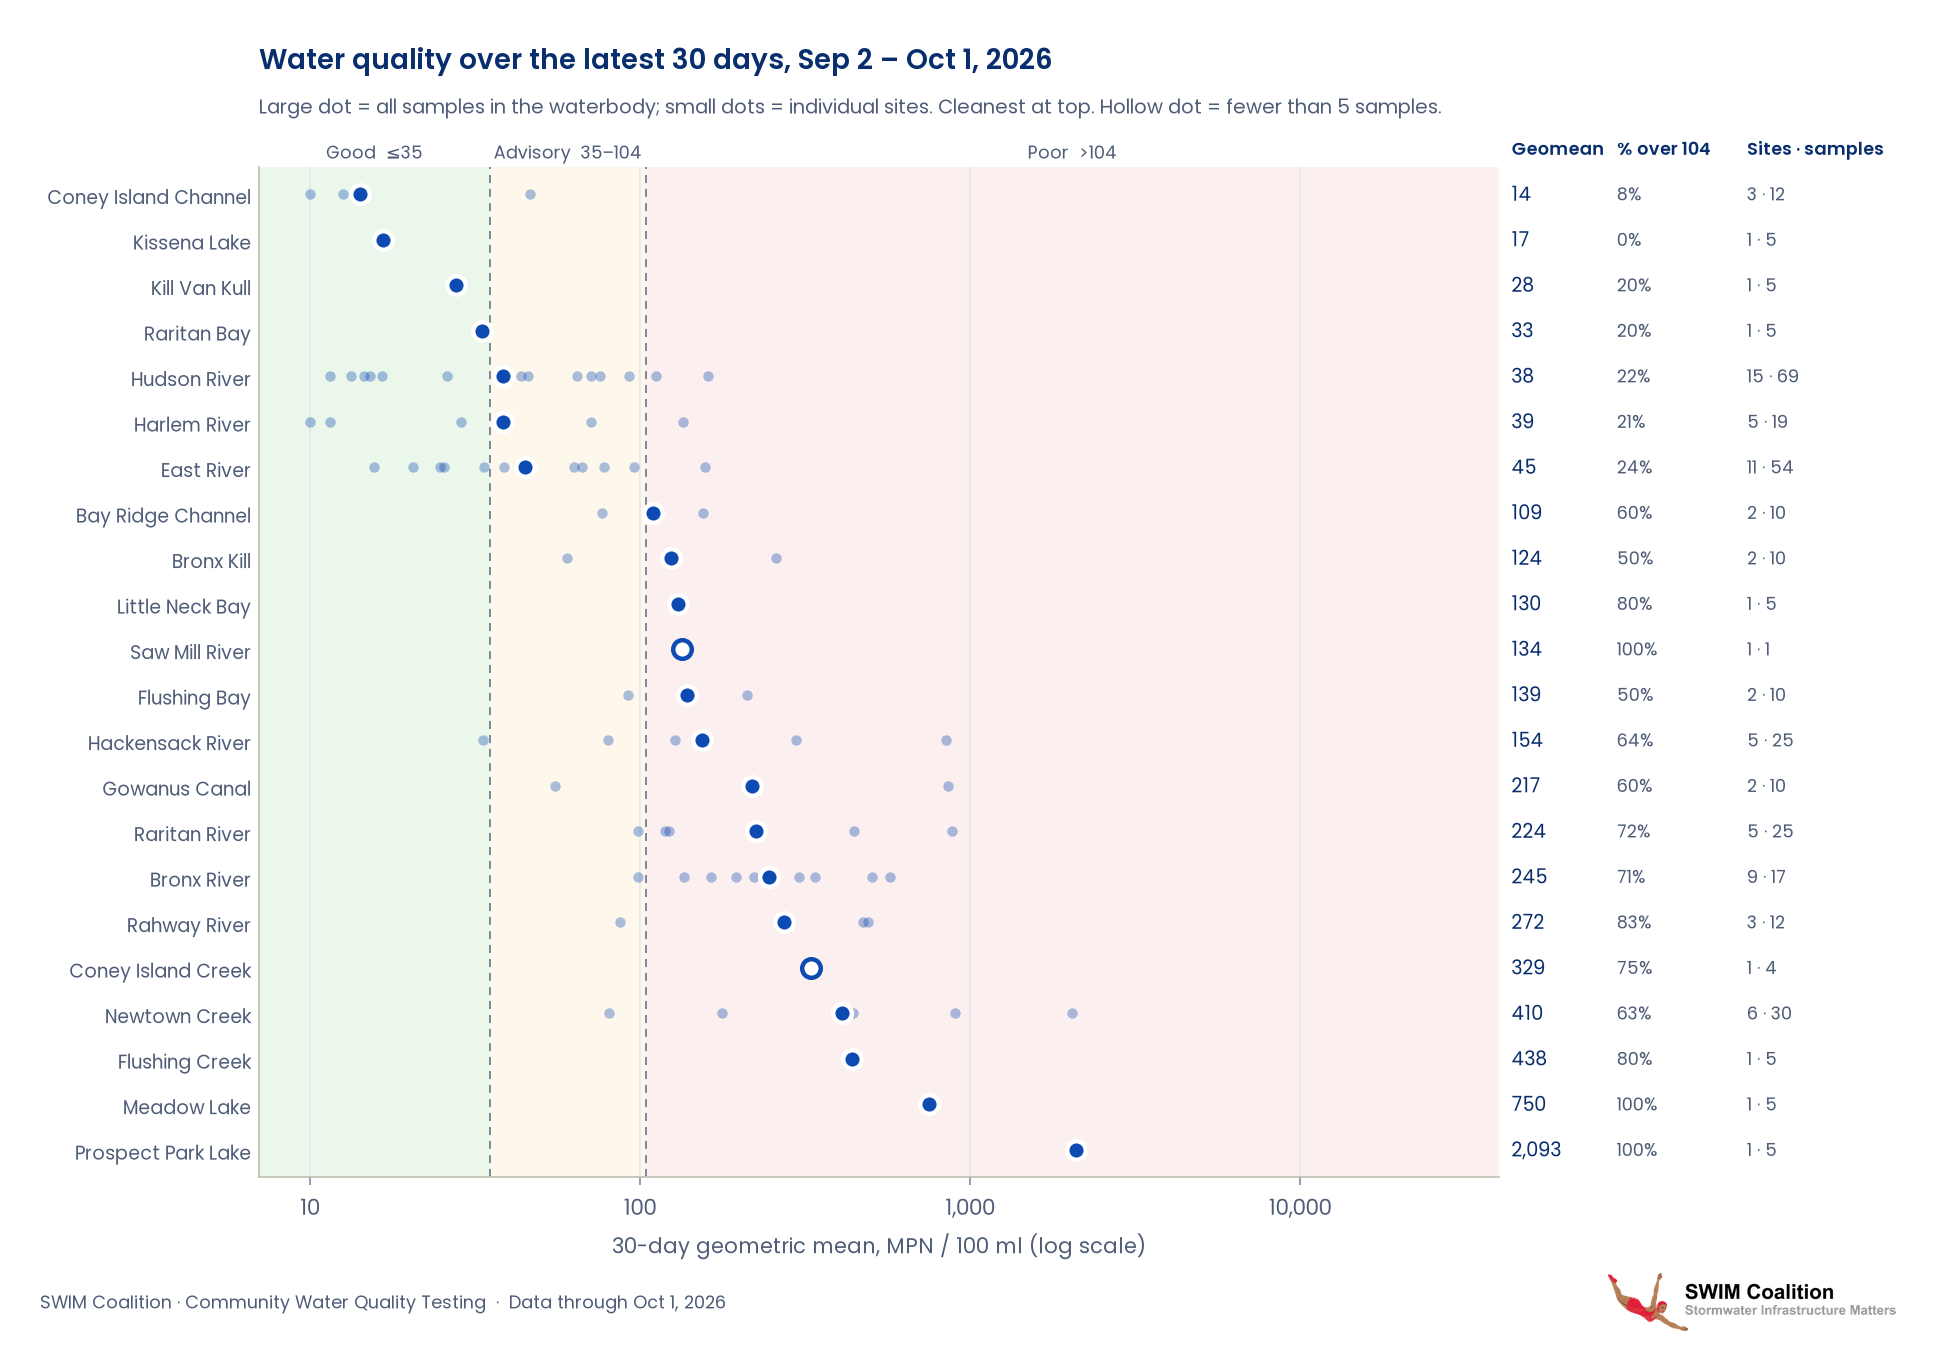
6. Water quality over the latest 30 days (Sep 2 – Oct 1, 2026)
Each row is a waterbody, ordered from cleanest to most contaminated over the most recent 30 days of sampling. The large dot is the geometric mean of all samples in that waterbody, and small dots are its individual sites. Hollow dots mark waterbodies with fewer than 5 samples in the window. The right-hand side shows the share of samples above 104 and the number of sites and samples.
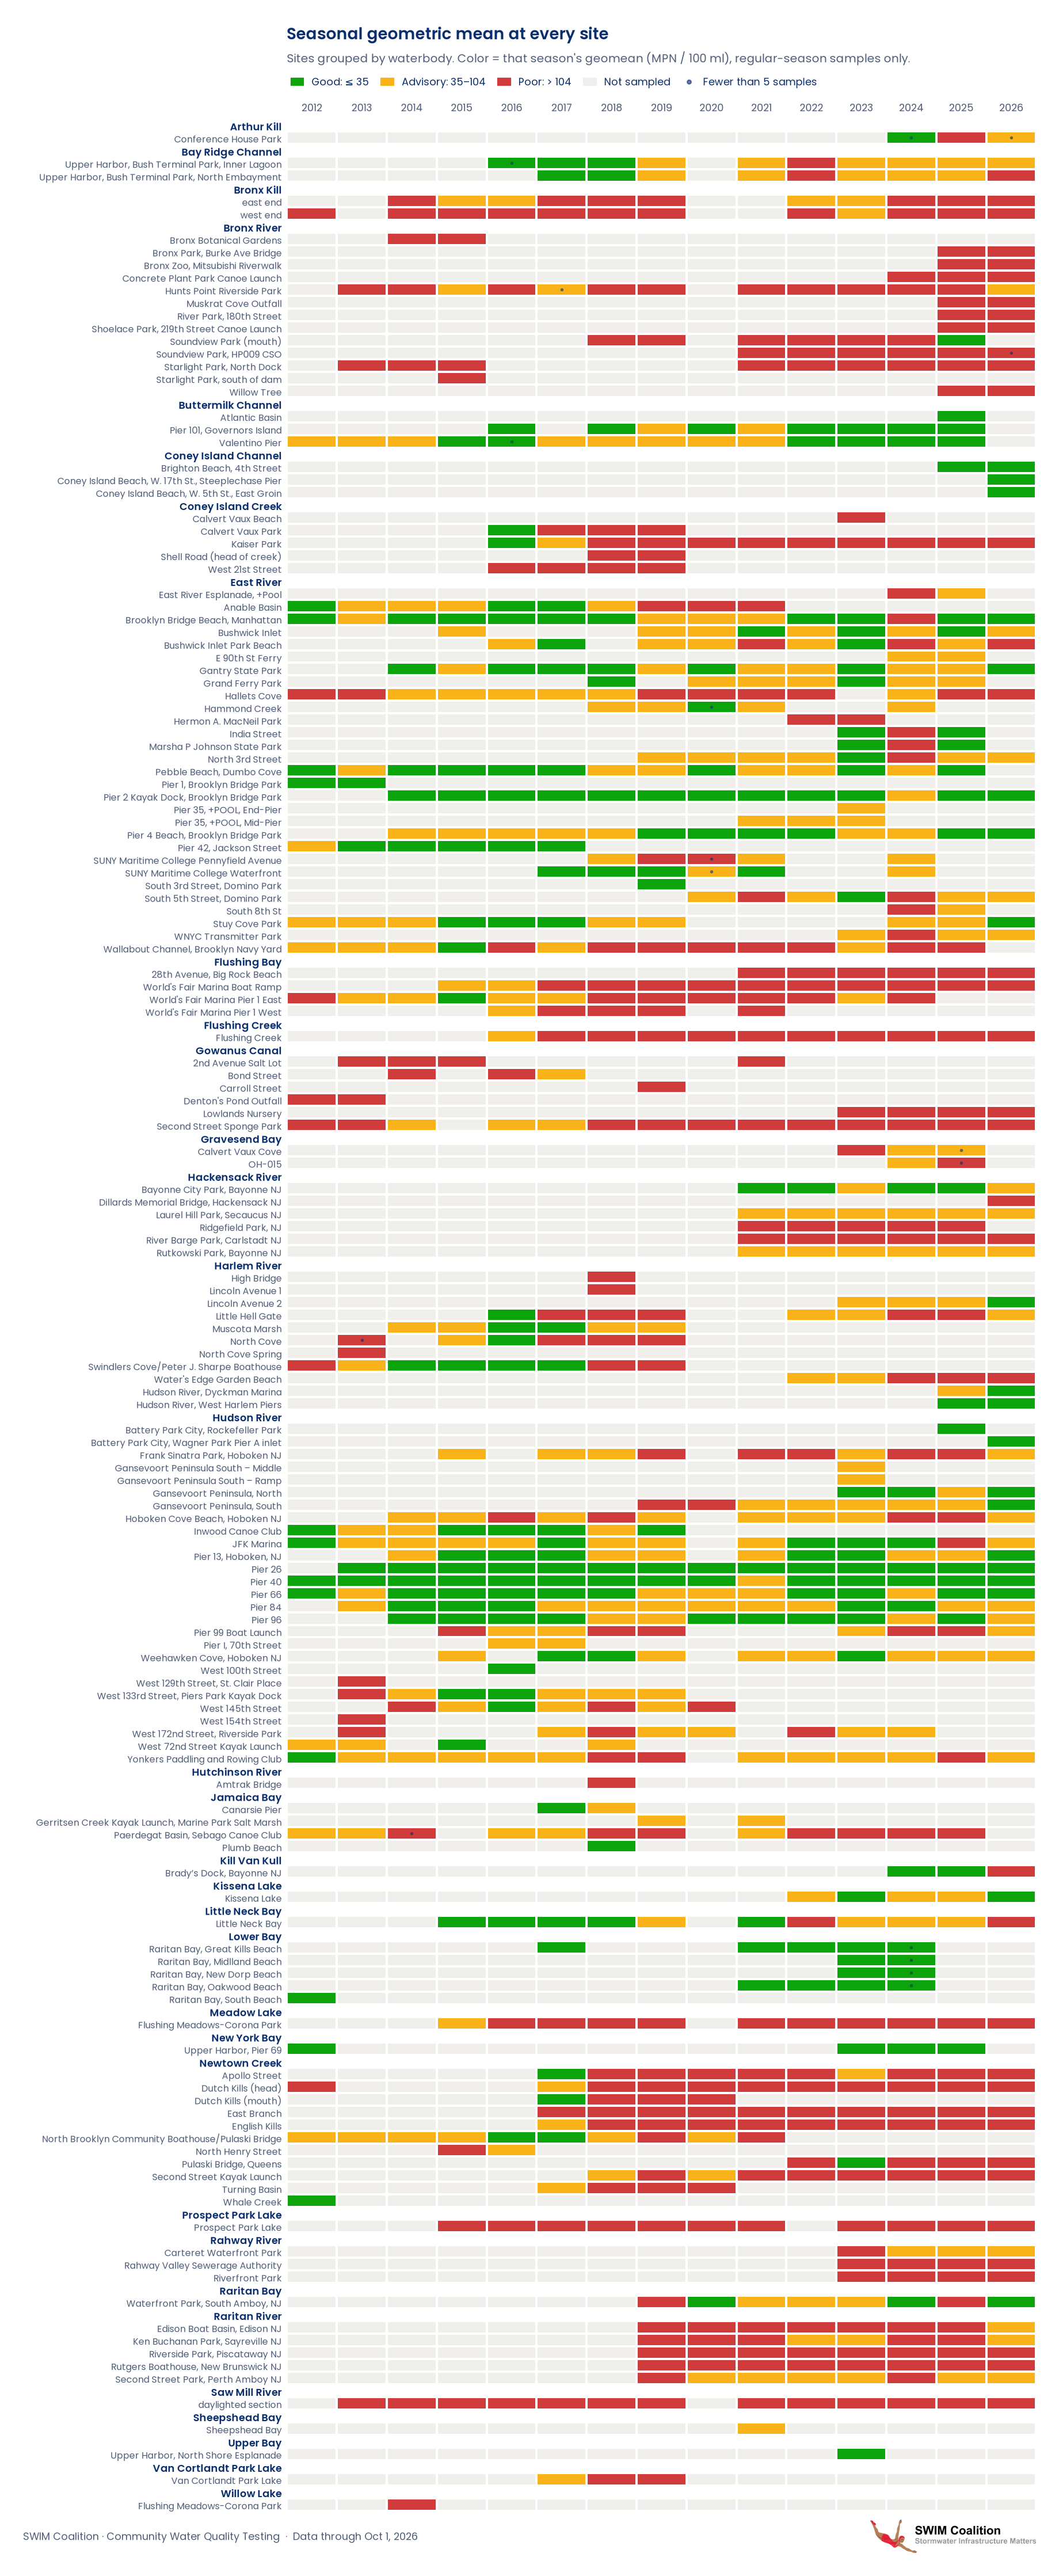
7. Every site, every season
One row per site, grouped by waterbody, and one column per season. Each cell is colored by that season's geometric mean (good, advisory or poor), and gray means the site wasn't sampled. Use it to spot sites that are improving, getting worse or consistently poor. Scroll inside the image to see all sites.
8. Full time series for each site
Each site's PDF has two pages. Page 1 shows the site's geometric mean season by season, colored good, advisory or poor. Page 2 shows every regular-season sample, with dry- and wet-weather samples marked. Choose a site below, or download all sites in one PDF.
Arthur Kill (1 site)
Bay Ridge Channel (2 sites)
Bronx River (13 sites)
- Bronx Botanical Gardens
- Bronx Park, Burke Ave Bridge
- Bronx Zoo, Mitsubishi Riverwalk
- Concrete Plant Park Canoe Launch
- Hunts Point Riverside Park
- Muskrat Cove Outfall
- River Park, 180th Street
- Shoelace Park, 219th Street Canoe Launch
- Soundview Park (mouth)
- Soundview Park, HP009 CSO
- Starlight Park, North Dock
- Starlight Park, south of dam
- Willow Tree
Buttermilk Channel (3 sites)
Coney Island Channel (3 sites)
Coney Island Creek (5 sites)
East River (29 sites)
- East River Esplanade, +Pool
- Anable Basin
- Brooklyn Bridge Beach, Manhattan
- Bushwick Inlet
- Bushwick Inlet Park Beach
- E 90th St Ferry
- Gantry State Park
- Grand Ferry Park
- Hallets Cove
- Hammond Creek
- Hermon A. MacNeil Park
- India Street
- Marsha P Johnson State Park
- North 3rd Street
- Pebble Beach, Dumbo Cove
- Pier 1, Brooklyn Bridge Park
- Pier 2 Kayak Dock, Brooklyn Bridge Park
- Pier 35, +POOL, End-Pier
- Pier 35, +POOL, Mid-Pier
- Pier 4 Beach, Brooklyn Bridge Park
- Pier 42, Jackson Street
- SUNY Maritime College Pennyfield Avenue
- SUNY Maritime College Waterfront
- South 3rd Street, Domino Park
- South 5th Street, Domino Park
- South 8th St
- Stuy Cove Park
- WNYC Transmitter Park
- Wallabout Channel, Brooklyn Navy Yard
Flushing Bay (4 sites)
Flushing Creek (1 site)
Gowanus Canal (6 sites)
Gravesend Bay (2 sites)
Hackensack River (6 sites)
Harlem River (11 sites)
Hudson River (27 sites)
- Battery Park City, Rockefeller Park
- Battery Park City, Wagner Park Pier A inlet
- Frank Sinatra Park, Hoboken NJ
- Gansevoort Peninsula South – Middle
- Gansevoort Peninsula South – Ramp
- Gansevoort Peninsula, North
- Gansevoort Peninsula, South
- Hoboken Cove Beach, Hoboken NJ
- Inwood Canoe Club
- JFK Marina
- Pier 13, Hoboken, NJ
- Pier 26
- Pier 40
- Pier 66
- Pier 84
- Pier 96
- Pier 99 Boat Launch
- Pier I, 70th Street
- Weehawken Cove, Hoboken NJ
- West 100th Street
- West 129th Street, St. Clair Place
- West 133rd Street, Piers Park Kayak Dock
- West 145th Street
- West 154th Street
- West 172nd Street, Riverside Park
- West 72nd Street Kayak Launch
- Yonkers Paddling and Rowing Club
Hutchinson River (1 site)
Jamaica Bay (4 sites)
Kill Van Kull (1 site)
Kissena Lake (1 site)
Little Neck Bay (1 site)
Lower Bay (5 sites)
Meadow Lake (1 site)
New York Bay (1 site)
Newtown Creek (11 sites)
Prospect Park Lake (1 site)
Rahway River (3 sites)
Raritan Bay (1 site)
Raritan River (5 sites)
Saw Mill River (1 site)
Sheepshead Bay (1 site)
Upper Bay (1 site)
Van Cortlandt Park Lake (1 site)
Willow Lake (1 site)